


Introduction to OpenTelemetry
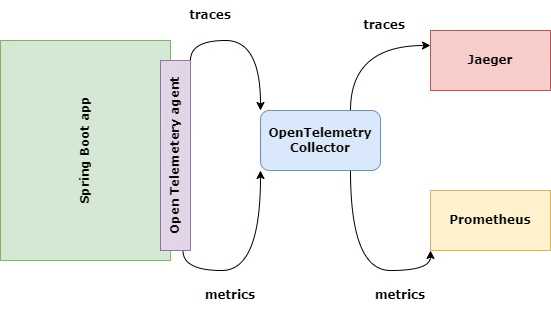
OpenTelemetry is a vendor-neutral open-source project that provides a standardized way to collect and manage telemetry data. It supports traces, metrics, and logs, which are essential for monitoring distributed systems. By integrating Telemetry in Spring Boot using Open Telemetry, you can gain deep insights into your application’s performance and behavior.
Key Features of OpenTelemetry:
- Cross-Language Support: OpenTelemetry supports multiple programming languages, including Java.
- Extensibility: It allows you to add custom instrumentation and extend its capabilities.
- Interoperability: You can export telemetry data to various backends like Jaeger, Prometheus, and Grafana.
Step 1: Setting Up a Spring Boot Project
Before diving into Telemetry in Spring Boot, let’s set up a basic Spring Boot application.
Creating a Spring Boot Application
- Generate a Spring Boot Project: You can use Spring Initializr to generate a Spring Boot project with the necessary dependencies. If you are new to Spring Boot, please read my article on Spring Boot here
- Add Dependencies: In your pom.xml, include the following dependencies for Spring Web and OpenTelemetry. This will enable Telemetry in Spring Boot
<dependencies>
    <dependency>
        <groupId>org.springframework.boot</groupId>
        <artifactId>spring-boot-starter-web</artifactId>
    </dependency>
    <dependency>
        <groupId>io.opentelemetry.instrumentation</groupId>
        <artifactId>opentelemetry-spring-boot-starter</artifactId>
        <version>1.15.0</version>
    </dependency>
    <dependency>
        <groupId>io.opentelemetry</groupId>
        <artifactId>opentelemetry-exporter-otlp</artifactId>
        <version>1.15.0</version>
    </dependency>
</dependencies>
This will set up a basic Spring Boot application with OpenTelemetry support.
Step 2: Configuring Telemetry in Spring Boot
With your project set up, the next step is to configure OpenTelemetry in your Spring Boot application.
Setting Up OpenTelemetry SDK
OpenTelemetry SDK is the core library that provides APIs and configuration options for telemetry data. By default, the opentelemetry-spring-boot-starter will auto-configure the SDK for you.
Configuring Exporters
Exporters handle the task of transmitting the gathered telemetry data to a backend system. Let’s configure Jaeger as a tracing backend:
Add Jaeger Exporter Dependency:
<dependency>
    <groupId>io.opentelemetry</groupId>
    <artifactId>opentelemetry-exporter-jaeger</artifactId>
    <version>1.15.0</version>
</dependency>
Configure Jaeger in application.properties:
otel.exporter.jaeger.endpoint=http://localhost:14250
otel.traces.exporter=jaeger
otel.metrics.exporter=none
Step 3: Instrumenting Your Spring Boot Application
Instrumentation is the process of collecting telemetry data from your application. OpenTelemetry offers the capability for both automatic and manual instrumentation.
Automatic Instrumentation
The opentelemetry-spring-boot-starter automatically instruments common Spring Boot components like RestController and RestTemplate. This means that without writing any additional code, your application’s REST endpoints will be automatically traced.
Manual Instrumentation with Annotations
You can manually instrument specific methods or components using annotations. For example:
import io.opentelemetry.extension.annotations.WithSpan;
import org.springframework.web.bind.annotation.GetMapping;
import org.springframework.web.bind.annotation.RestController;

@RestController
public class GreetingController {

    @WithSpan
    @GetMapping("/greet")
    public String greet() {
        return "Hello, OpenTelemetry!";
    }
}
In this example, the @WithSpan annotation ensures that the greet method is traced.
Adding Custom Spans
For more fine-grained control, you can create custom spans within your methods:
import io.opentelemetry.api.trace.Span;
import io.opentelemetry.api.trace.Tracer;
import org.springframework.web.bind.annotation.GetMapping;
import org.springframework.web.bind.annotation.RestController;

@RestController
public class CustomSpanController {

    private final Tracer tracer;

    public CustomSpanController(Tracer tracer) {
        this.tracer = tracer;
    }

    @GetMapping("/custom-span")
    public String customSpan() {
        Span span = tracer.spanBuilder("customSpan").startSpan();
        try {
            // Perform some work
            return "Custom Span Example";
        } finally {
            span.end();
        }
    }
}
This code snippet creates a custom span named customSpan, allowing you to trace specific sections of your code.
Step 4: Collecting and Exporting Telemetry Data
With instrumentation in place, you can now collect and export telemetry data to various backends.
Viewing Traces with Jaeger
Jaeger is a popular distributed tracing tool that allows you to visualize traces. To run Jaeger locally, use Docker:
docker run -d --name jaeger \
  -e COLLECTOR_ZIPKIN_HTTP_PORT=9411 \
  -p 5775:5775/udp \
  -p 6831:6831/udp \
  -p 6832:6832/udp \
  -p 5778:5778 \
  -p 16686:16686 \
  -p 14268:14268 \
  -p 14250:14250 \
  -p 9411:9411 \
  jaegertracing/all-in-one:1.31
Access Jaeger UI at http://localhost:16686 to view the traces generated by your Spring Boot application.
Exporting Metrics to Prometheus
To export metrics, add the following dependency:
<dependency>
    <groupId>io.opentelemetry</groupId>
    <artifactId>opentelemetry-exporter-prometheus</artifactId>
    <version>1.15.0</version>
</dependency>
Then configure Prometheus in application.properties:
otel.metrics.exporter=prometheus
otel.exporter.prometheus.port=9464
Run Prometheus to scrape metrics from your Spring Boot application:
docker run -d --name=prometheus -p 9090:9090 prom/prometheusStep 5: Monitoring and Visualizing Data
To make sense of the collected data, you’ll need to monitor and visualize it using tools like Grafana.
Setting Up Grafana for Visualization
Grafana is an open-source visualization tool that integrates seamlessly with Prometheus and Jaeger.
Run Grafana:
docker run -d -p 3000:3000 --name=grafana grafana/grafanaAdd Data Sources:
In Grafana, add Prometheus and Jaeger as data sources.
Create Dashboards:
Use Grafana to create custom dashboards that display traces and metrics from your Spring Boot application.
Analyzing Traces and Metrics
With Grafana and Jaeger, you can analyze the performance of your application by viewing traces, identifying bottlenecks, and tracking essential metrics such as response time and throughput.
Conclusion
Integrating Telemetry in Spring Boot using Open telemetry allows you to gain valuable insights into your application’s performance. By following this step-by-step guide, you can set up OpenTelemetry, instrument your Spring Boot application, and visualize the collected telemetry data. Whether you’re building microservices or monitoring large-scale distributed systems, OpenTelemetry provides the observability tools you need to ensure your application is running smoothly.
This comprehensive guide has equipped you with the knowledge to start using OpenTelemetry in your Spring Boot applications. With the provided examples and code snippets, you can quickly implement and customize OpenTelemetry to fit your needs. Happy coding!